

So, what exactly is Data Visualization?
90 percent of information transmitted to the brain is visual and 65 percent of the population are visual learners. That being said, data is measured, collected and analyzed to help reach a set of conclusions, providing information to those who need it. Data is constantly being developed through our phones and websites we visit on the internet to create a better experience for its users and to market things that we may want or need. Yet one of the most important tools of data is data visualization, which is when quantitative and qualitative data is transformed into graphs, charts and images. Researchers at Pennsylvania School of Medicine found that the human retina can transmit data at about 10 million bits per second, showing how quickly our brain can understand images. Using data visualization tools gives people the ability to process information faster which will increase productivity and results.
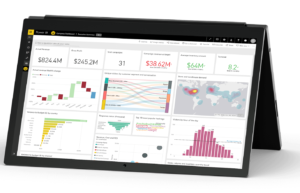

More companies utilize data visualization to help operate more efficiently because it is easier to spot areas for improvement. With access to real time data, companies can make decisions with their employees and customers in mind paving the way to success.

Microsoft Dynamics 365
and
PowerBI
allow companies to do this by breaking down information into images and patterns which make it easier for our brain to detect what is being shown. This software connects data from your phone, desktop, a third-party provider or the customer themselves in order to provide the company with complete results.
Benefits of Data Visualization
Data visualization provides an element of predictability. With the use of data, companies have the ability to start leveraging their data to provide insight to get ahead of problems before they happen and provide a higher level of service to their customers. It helps provide intelligence on when things are going to break so you know before it occurs, therefore you can start preventative maintenance. This way, companies can start to change the customer experience and customer interaction from a reactive to a predictive model. For example, you are a wind company that has multiple wind turbines throughout the country. Unfortunately, one turbine keeps having the same issue but the other ones do not, data visualization allows you to look at what’s going wrong in comparison to the other turbines that are working properly. Most of the time, someone calls a technician to come and fix it which leads to a lot of scheduling and troubleshooting. However, when you have access to live data this will not happen.
Another benefit of data visualization is using it to drive sales growth. Data visualization allows you to tell a story across multiple years. A company can be looking at its annual report over the past three years and notice a common trend throughout that their sales always decrease in Q3. Data can provide answer to these questions. Looking at a series of charts and graphs from past reports can further break down the data into parts that are easier to understand and most importantly, pinpoint the exact problem. Moving forward, you can manipulate your data to see your company’s growth trends and expected results in the upcoming quarters.
Further, data visualization can provide insight into the market to identify the best opportunities and upcoming trends in order to generate more revenue for your company. This process makes it easier to spot these opportunities through the use of visuals, while providing insight on the customers experience to see if their needs are being met. Once you understand the needs of your customer, it will be easier to tailor a unique experience based on that single customer and capitalize in the market. As a result, businesses will be able to develop new services and solutions for their customers keeping them ahead of their competitors.
Routeget Technologies offers comprehensive end-to-end capabilities around data visualization intelligence, including:
Data visualization strategy
To help companies understand their information needs and translate them into an actionable roadmap.
Report rationalization
To streamline existing reporting capabilities by using visualization and advanced analytics tools.
Data storytelling:
To adopt a seeing-is-believing methodology that enables ‘quick-win’ cycles, which would support and align with the overall business goals
Data visualization implementation:
To manage the program and successfully execute all related activities from strategy to governing the development, deployment, and consumption of the information.
Enterprise Architecture & ERP Implementation Governance
Transitioning complex organizational workflows into scalable ERP modernization architectures requires systematic alignment between core operational processes and underlying digital infrastructure across all operating subsidiaries. When executing enterprise deployments within intricate multi-entity business environments, organizations must rigorously prioritize data normalization, chart-of-accounts standardization, and unified telemetry architectures. Establishing resilient, pre-configured integration boundaries across legacy application estates directly eliminates technical debt while ensuring end-to-end data integrity across high-frequency transactional lifecycles. Cross-functional governance committees—uniting financial controllers, supply chain leaders, and enterprise technical architects—remain indispensable for maintaining strict configuration discipline and curbing procedural fragmentation across regional operating units.
Beyond core transactional execution, enduring platform longevity depends on deliberate organizational enablement and continuous operational validation across all stakeholder tiers. Implementing isolated sandbox environments, automated regression testing frameworks, and formalized release cadence protocols enables business units to absorb continuous platform enhancements without introducing unexpected downtime or operational friction. Enterprises that deliberately pair proactive telemetry monitoring with targeted role-based training programs consistently achieve accelerated user adoption, compress post-go-live stabilization horizons, and maximize the long-term return on strategic technology investments. This disciplined operating model provides the institutional agility needed to scale operations predictably.






No comment yet, add your voice below!